Getting Started
There are two ways to integrate XCMetrics in your project. Based on how much customizability you need and the kind of metrics you’d like to collect, you’ll need to take your decision. Here we describe the two approaches.
If you prefer a video version of how XCMetrics works and how you can integrate it in your project, please watch the following video.
Approach #1: Default Metrics Collection
XCMetrics supports a few arguments out of the box that allow you to start sending the default set of metrics to any supported backend service. In this getting started guide, we will show how to integrate XCMetrics in our example project named BasicApp. You can find the completed example app in the Examples/BasicApp directory. Feel free to follow along with your own project.
One of the pre-requisites is to get a binary release of XCMetrics directly from our GitHub repo or compile it locally. In this case, we’ll compile it locally since it’s already in the repo, but we recommend to package it and download it as part of your project configuration steps in order to save time to your developers.
If you’re downloading a pre-built executable version of XCMetrics, you can skip the following section.
Compile XCMetrics Executable
In a terminal window inside the XCMetrics repo, run the following:
swift build --product XCMetrics -c release
An executable named XCMetrics will be place inside .build/release/XCMetrics. This is the executable that manages the metrics collection for you.
Xcode Integration
Now that we have an XCMetrics executable, we can proceed with the integration in your project. Open your xcodeproj (BasicApp.xcodeproj if you’re following our example), select your scheme and press “Edit Scheme”.

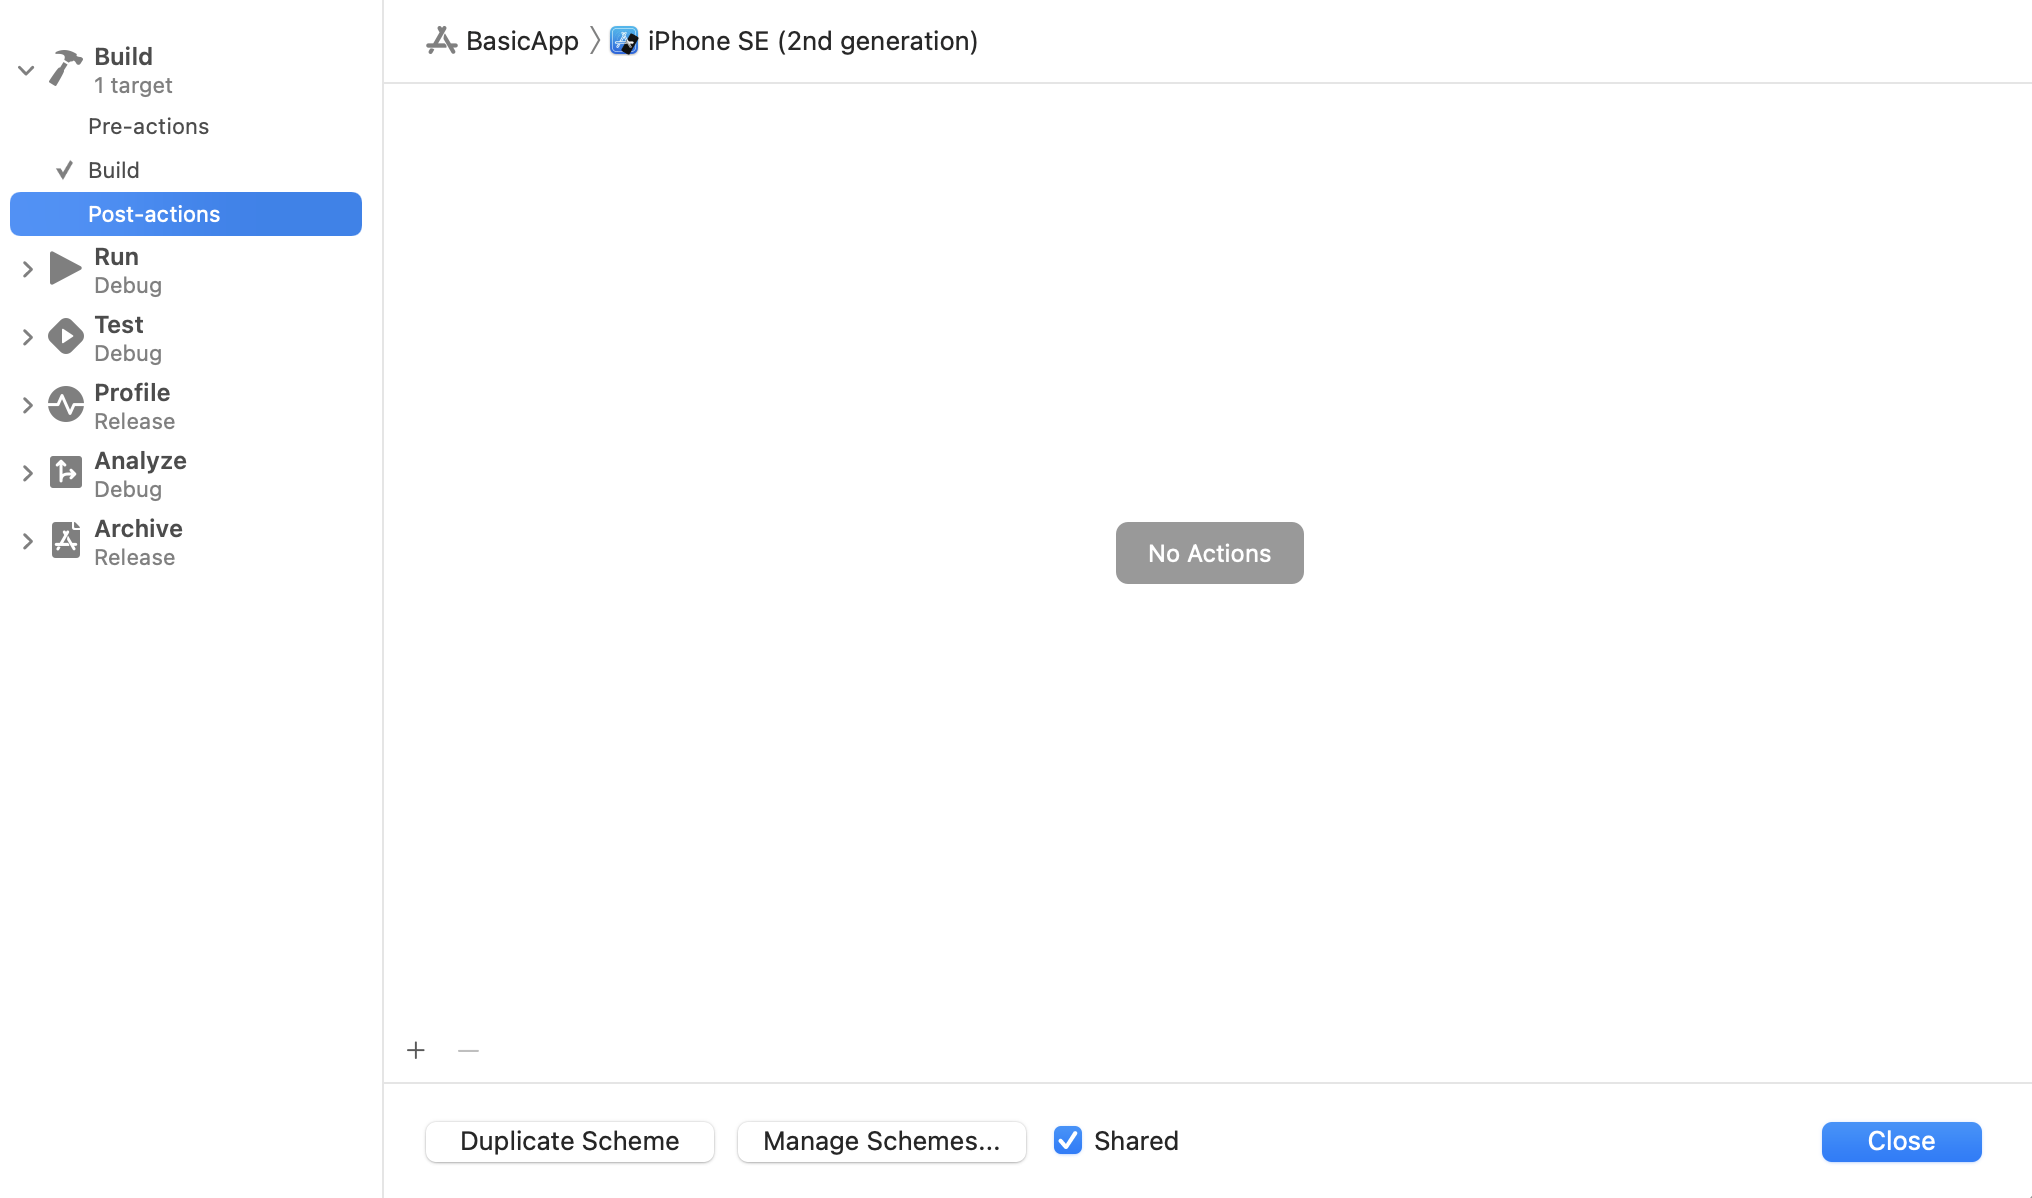
Expand the “Build” left panel to reveal pre and post-actions. Let’s create a new post-action by pressing on the “+” button.

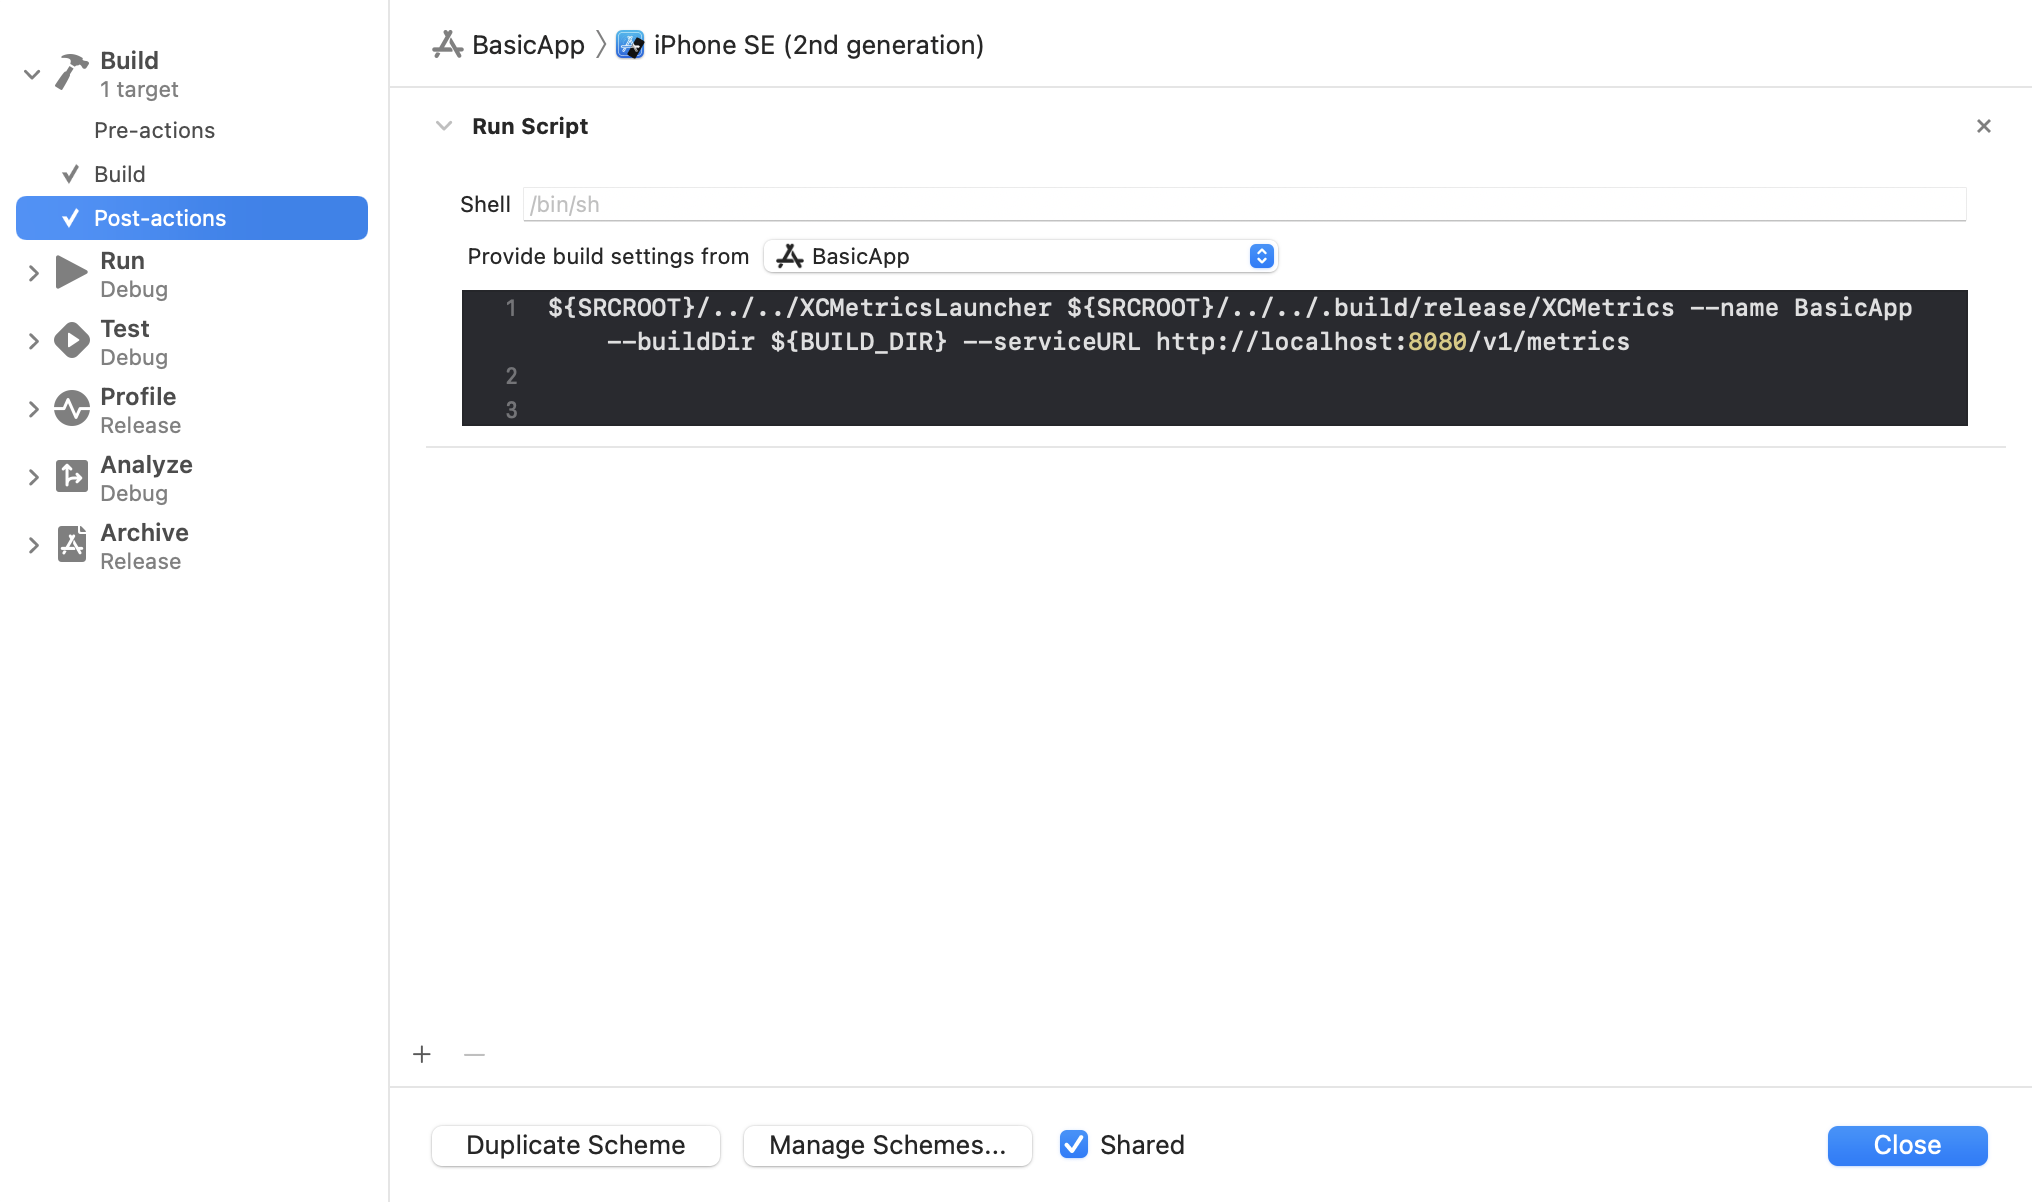
Make sure to select your target in “Provide build settings from” in order to provide the build settings to the post-action scheme (required for the next step). Paste the following script in the text area:
${SRCROOT}/../../XCMetricsLauncher ${SRCROOT}/../../.build/release/XCMetrics --name BasicApp --buildDir ${BUILD_DIR} --serviceURL https://yourservice.com/v1/metrics
This is how the post-action scheme should look like. Let’s break it down:
-
${SRCROOT}/../../XCMetricsLauncheris a launcher script that is to make our post-scheme action run in the background and let Xcode finish the build cleanly. More information on why this is needed is available in its docs. - The previous script then accepts the
XCMetricsexecutable location. In this case it’s in the Swift Package Manager build directory, but it could really be anywhere on your system. - Some required parameters are then passed to the executable:
-
--name: the name of the project where we are collecting the metrics. This could be your scheme name of project name for example. -
--buildDir: the build directory of the project where we are collecting the metrics. This is the value of theBUILD_DIRvariable, thus why before we needed to make sure the build environment variables are shared to our post-action scheme. -
--serviceURL: the URL of the service receiving the collected metrics. If you haven’t deployed a service yet, please head over to “Deploy Backend” first. -
--timeout: the number of seconds to wait for the Xcode log to appear. The default value is 5s. -
--isCI: either true or false based on if the current build is running on CI or not. This is useful to categorize builds as local or continuous integration builds. -
--skipNotes: true or false. If true, the Notes found in a log (Xcode adds them to with things like the output of Post build phase’s scripts like Swiftlint) won’t be inserted in the Database. Useful if you have thousands of these in your log and want to save some space. -
--authorizationKey: An optional authorization header key to be included in the upload request e.g ‘Authorization’ or ‘x-api-key’ etc. This is ignored by the XCMetrics backend service, but can be consumed by a 3rd party service to facilitate a basic level of authentication. An example of this would be using an AWS API Gateway API Key. Must be used in conjunction withauthorizationValue. -
--authorizationValue: An optional authorization header value to be included in the upload request e.g ‘Basic YWxhZGRpbjpvcGVuc2VzYW1l’ orhYDqG78OIUDIWKLdwjdwhdu8etc. This is ignored by the XCMetrics backend service, but can be consumed by a 3rd party service to facilitate a basic level of authentication. An example of this would be using an AWS API Gateway API Key. Must be used in conjunction withauthorizationKey. -
--truncateLargeIssues: Optional flag. Iftrue, individual tasks with more than a 100 issues (either Warnings, Errors or Notes) will get their issues truncated to a 100. This is useful to save up database space, fix memory issues in the backend and speed up log processing. -
--additionalHeaderJson: Optinal flag. Wiht this, is possible to define aditional headers with a stringfied json. This option will be merged with--authorizationKeyand--authorizationValuewhen they exists. Usage:XCMetrics --additionalHeaderJson '{"Api-Key":"123","Authorization":"bearer 456"}'.
-

If you build the scheme now, the build metrics should be sent to your service as soon as the build completes!
Default Metrics
All the metrics produced by Xcode in the xcactivitylog are of course collected:
- Build Information
- Build Steps
- Build Targets
- Warnings
- Errors
- Function compilation times and type-check information (requires a
swiftcflag to be passed in order for the compiler to emit the data) - Notes
The following metrics are also collected by default for each build:
- Hardware information: CPU model, CPU count, hardware model, macOS version and more.
- Xcode version: build number, version string and build identifier.
- Tag: an optional tag to easily identify a build, such as a benchmark build or some other well-known build type.
Approach #2: Custom Metrics Collection
If you need more customizability and you would like to build your own plugins to collect even more data alongside each build, the solution is to write your own SPM packages to extend XCMetrics. At Spotify for example, we have SPTXCMetrics which collects even more data from developers’ machines to make our analysis on build data more powerful and detailed.
SPM Package Creation
Start by creating a new SPM package with the following command:
swift package init --type executable
Add XCMetrics Dependency
Open the newly created Package.swift and modify it as following (this is an example of our internal SPTXCMetrics implementation):
// swift-tools-version:5.2
// The swift-tools-version declares the minimum version of Swift required to build this package.

import PackageDescription

let package = Package(
    name: "client",
    platforms: [
        .macOS(.v10_15),
    ], products: [
        .executable(name: "SPTXCMetrics", targets: ["SPTXCMetricsApp"]),
    ],
    dependencies: [
         .package(url: "https://github.com/spotify/XCMetrics", from: "0.1.0"),
    ],
    targets: [
        .target(
            name: "SPTXCMetrics",
            dependencies: [.product(name: "XCMetricsClient", package: "XCMetrics")]),
        .target(
            name: "SPTXCMetricsApp",
            dependencies: ["SPTXCMetrics"]
        ),
        .testTarget(
            name: "SPTXCMetricsTests",
            dependencies: ["SPTXCMetrics"]),
    ]
)
We now have wrapped XCMetrics in a new SPTXCMetris target. This target can include more plugins and logic that will be executed by XCMetrics when collecting metrics.
Plugin Architecture Overview
XCMetrics and XCMetricsApp will not accept substantial new features. We built XCMetrics to be extensible and configurable from your own Swift Package. We would still like to offer a series of plugins that you can directly reuse without rewriting common metrics collection plugins. The XCMetricsPlugins library is available for you to depend on. It allows you to add more metrics collection capabilities to your version of XCMetrics.
Start by adding a dependency on XCMetricsPlugins to the newly created SPTXCMetrics target:
.target(
    name: "SPTXCMetrics",
    dependencies: [
        .product(name: "XCMetricsClient", package: "XCMetrics"),
        .product(name: "XCMetricsPlugins", package: "XCMetrics")
    ]
),
Here’s an example of a custom version of XCMetrics named SPTXCMetrics that adds thermal throttling information (that can usually affect build times) collection by using a plugin available in XCMetricsPlugins.
import Foundation
import XCMetricsClient
import XCMetricsPlugins

public struct SPTXCMetrics {

    public static func main() {
        let metrics = XCMetrics.parseOrExit()
        let configuration = XCMetricsConfiguration()
        configuration.add(plugin: ThermalThrottlingPlugin().create()) // ThermalThrottlingPlugin lives in XCMetricsPlugins.
        metrics.run(with: configuration)
    }
}
For examples on how to write custom plugins, take a look at the existing plugins in XCMetricsPlugins. In short, each plugin is given access to the environment variables of the build in a dictionary for even higher customizability. You can provide values from your build environment and track them when collecting metrics for example. Each plugin should return a dictionary of values that will be attached to each build and stored as build metadata.
Feel free to contribute new plugins to XCMetricsPlugins. We’re happy to add more features in order to make them available to the wider community.
Pro & Debugging Tips
For some reason, Xcode doesn’t execute the post-action scheme in case the build fails. To force Xcode to execute the post-action scheme even if the build fails, add runPostActionsOnFailure = "YES" as an attribute of the BuildAction tag in your xscheme (like we do in our BasicApp.xcsheme).
In case of issues, here are some useful tips on how to debug them:
- The post-action scheme is ran in a temporary directory created by Xcode, so you should use absolute paths when referencing files or executables.
- The post-action scheme doesn’t print its output anywhere. If you’re trying to debug something, you redirect stdout and stderr to files on disk to inspect them (e.g: append to your command
> ~/Desktop/error.txt 2>&1) - If you think the problem is inside
XCMetrics, you can inspect its logs by using the Console app and filtering forXCMetricsAppor use the following command:log show --start '2020-10-05 12:05:00' --info --predicate "process like 'XCMetricsApp'"


