Discover valuable insights hiding inside Xcode’s build logs
Track your team’s build metrics
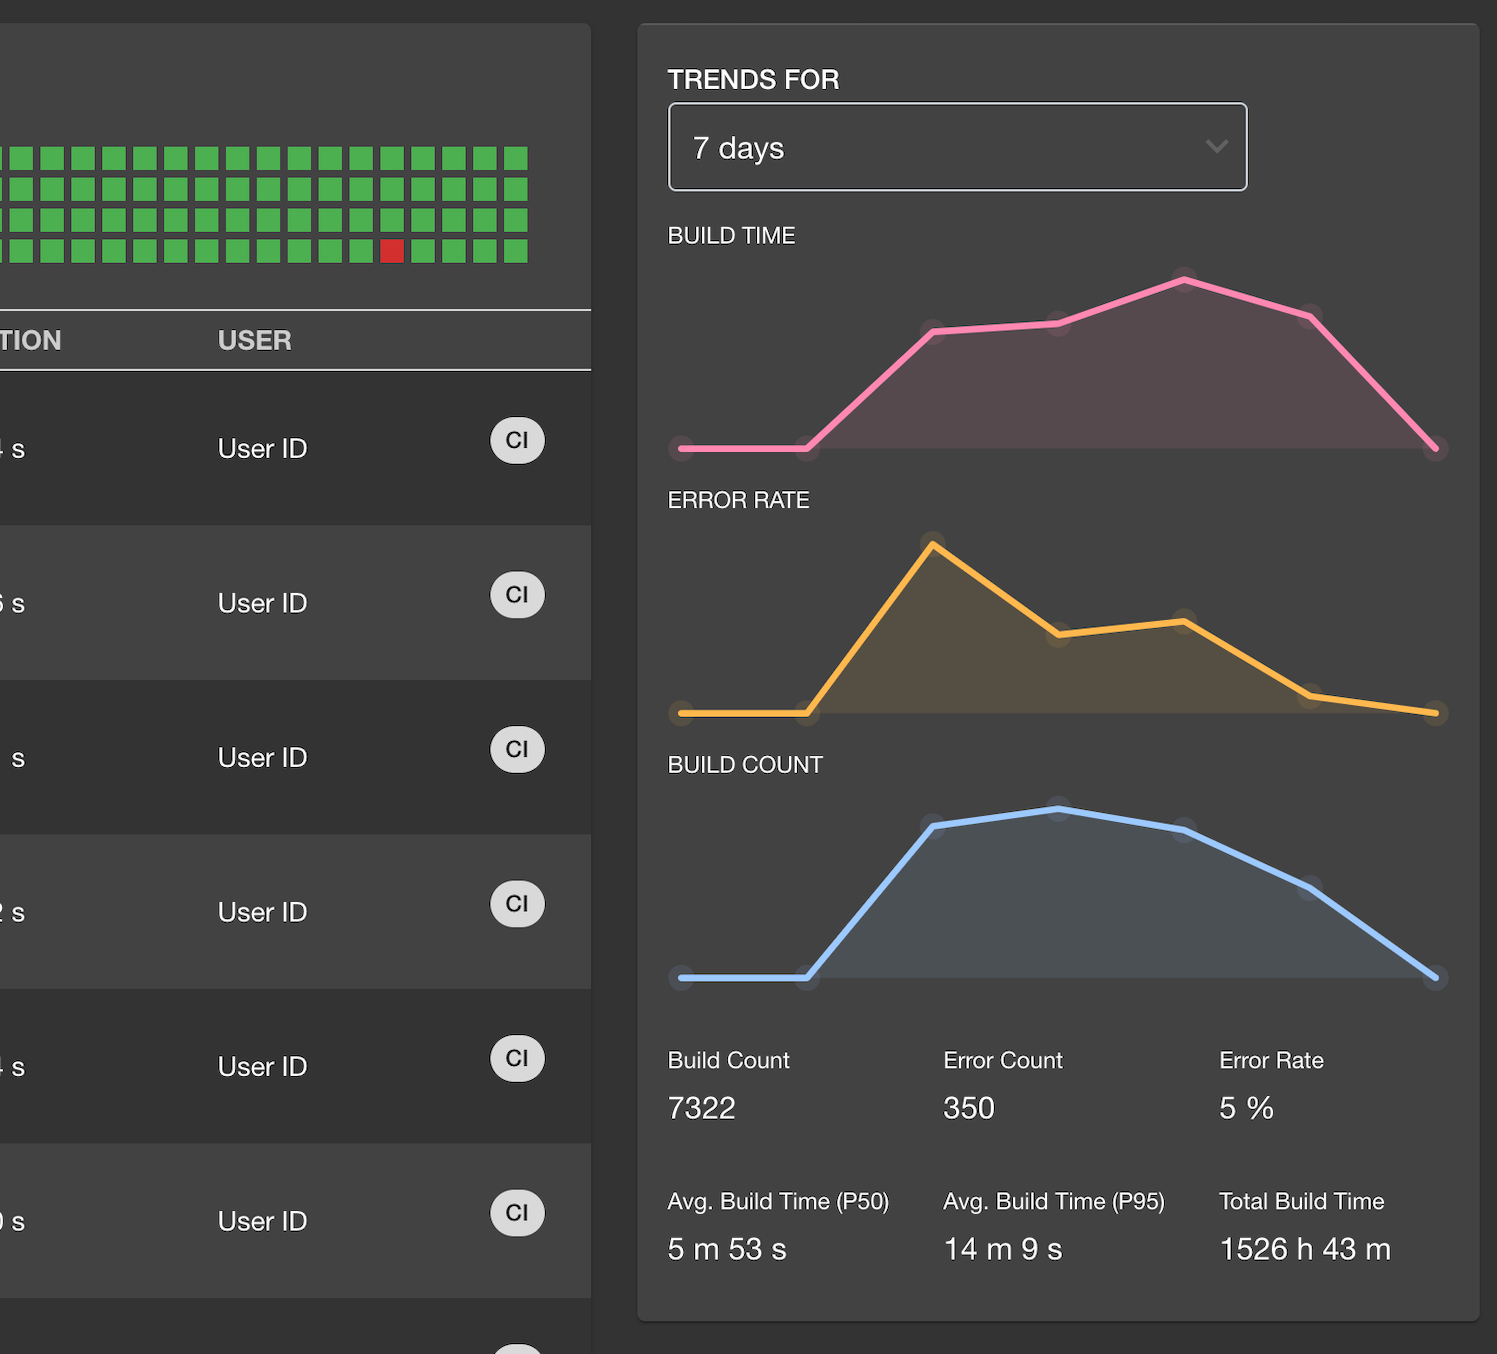
Are your team’s build times improving or regressing? Which version of Xcode is slowest? Which hardware setup is fastest? XCMetrics makes it easy to find out all this and more by collecting, displaying, and tracking the data inside your team’s Xcode build logs.
Made for (and by) iOS engineers
XCMetrics works with teams of all sizes. Made for iOS engineers by iOS engineers, the tool is written completely in Swift, making it easy to customize. Track the data you want to see, the way you want to see it — and use the insights to improve developer experience and productivity.
All your build data, all in one place
Whenever you run a local or continuous integration build, Xcode and xcodebuild produce a log file. XCMetrics automatically collects these build logs from everyone on your team.
Sort, search, track, discover
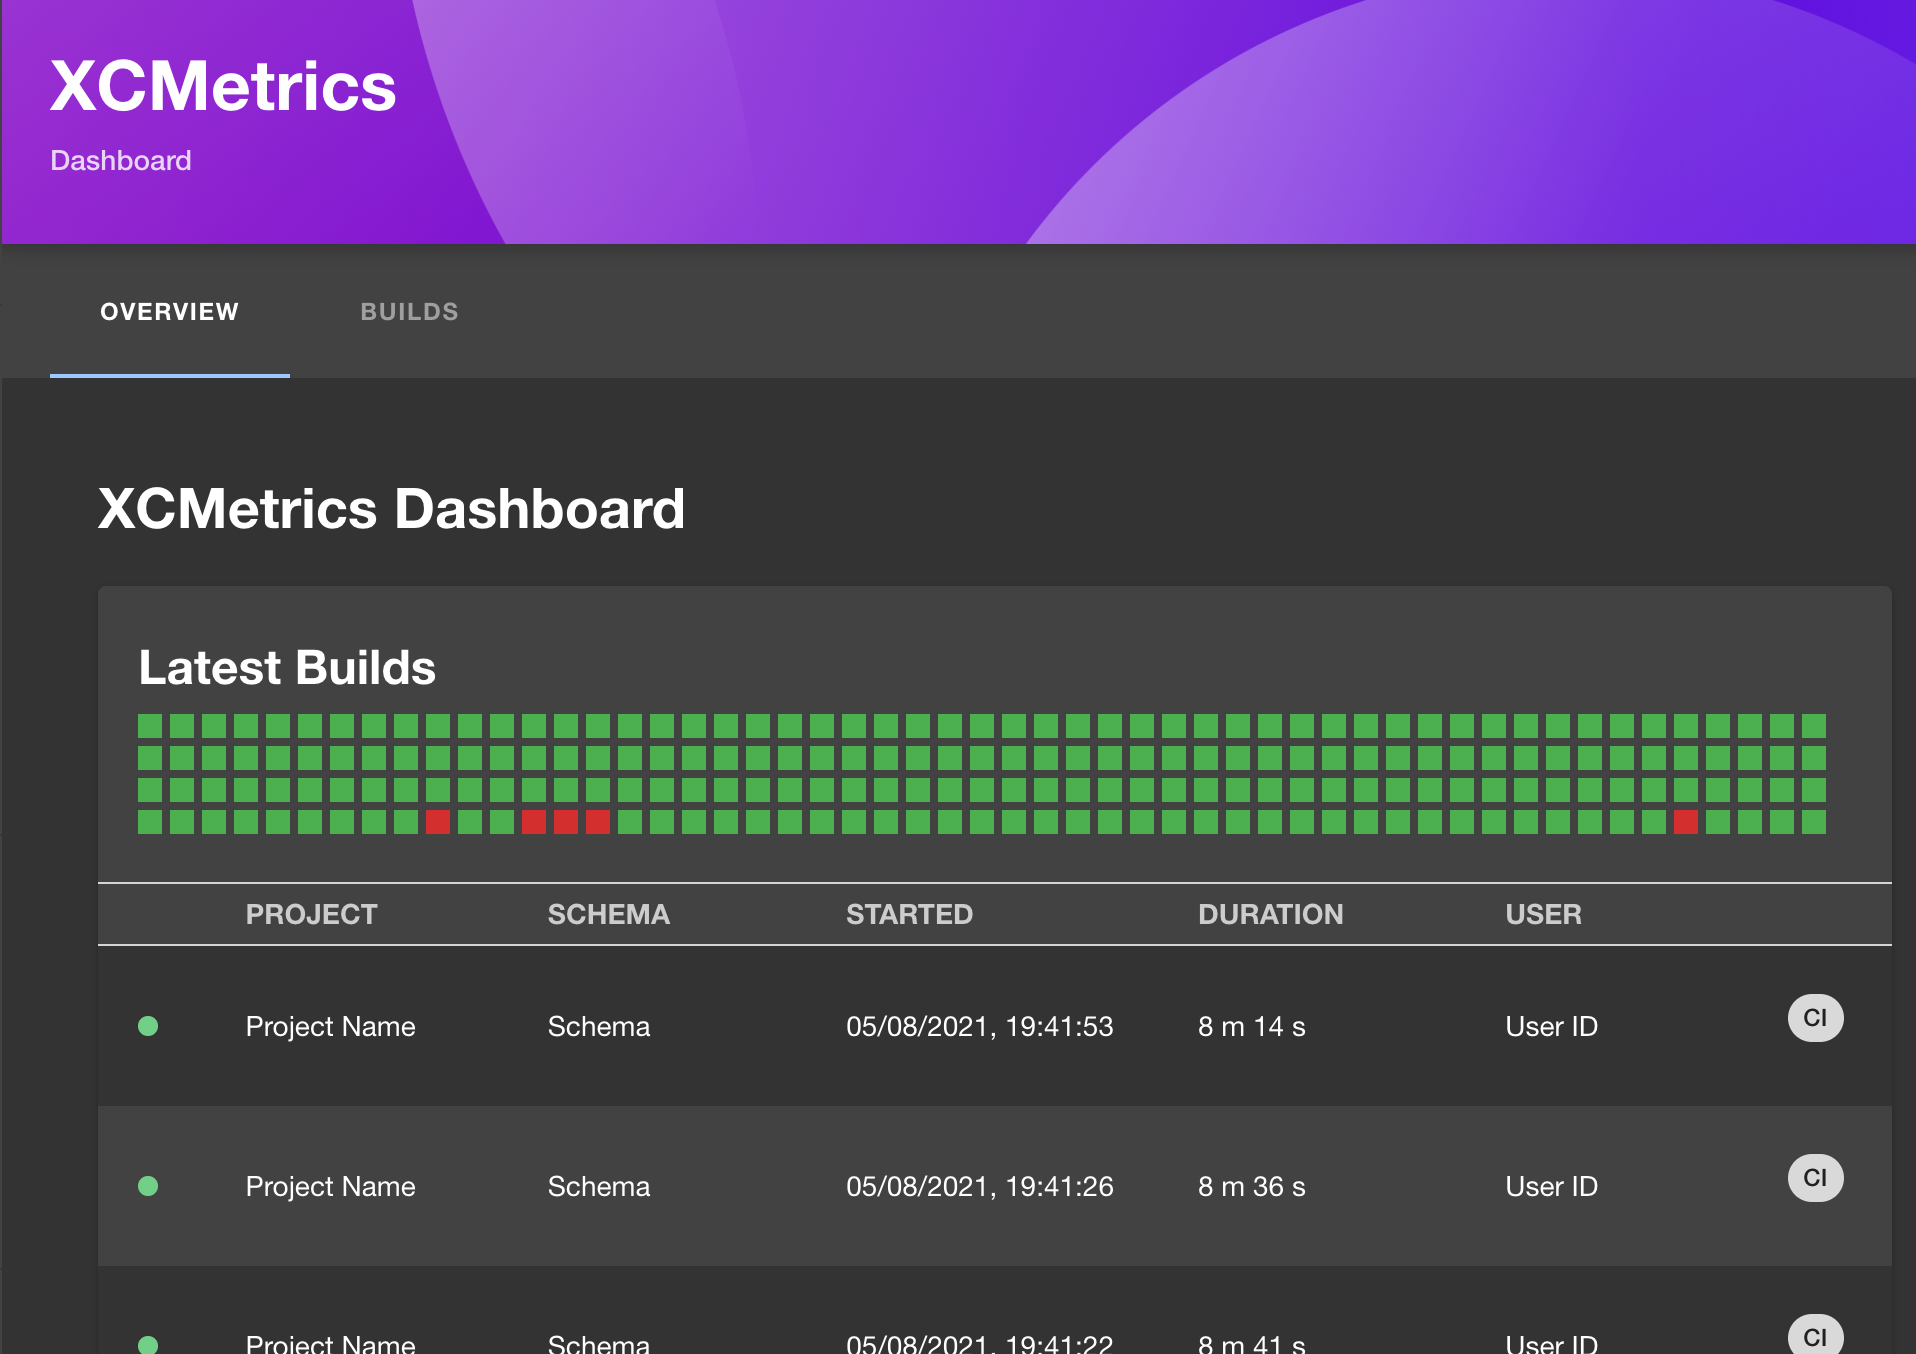
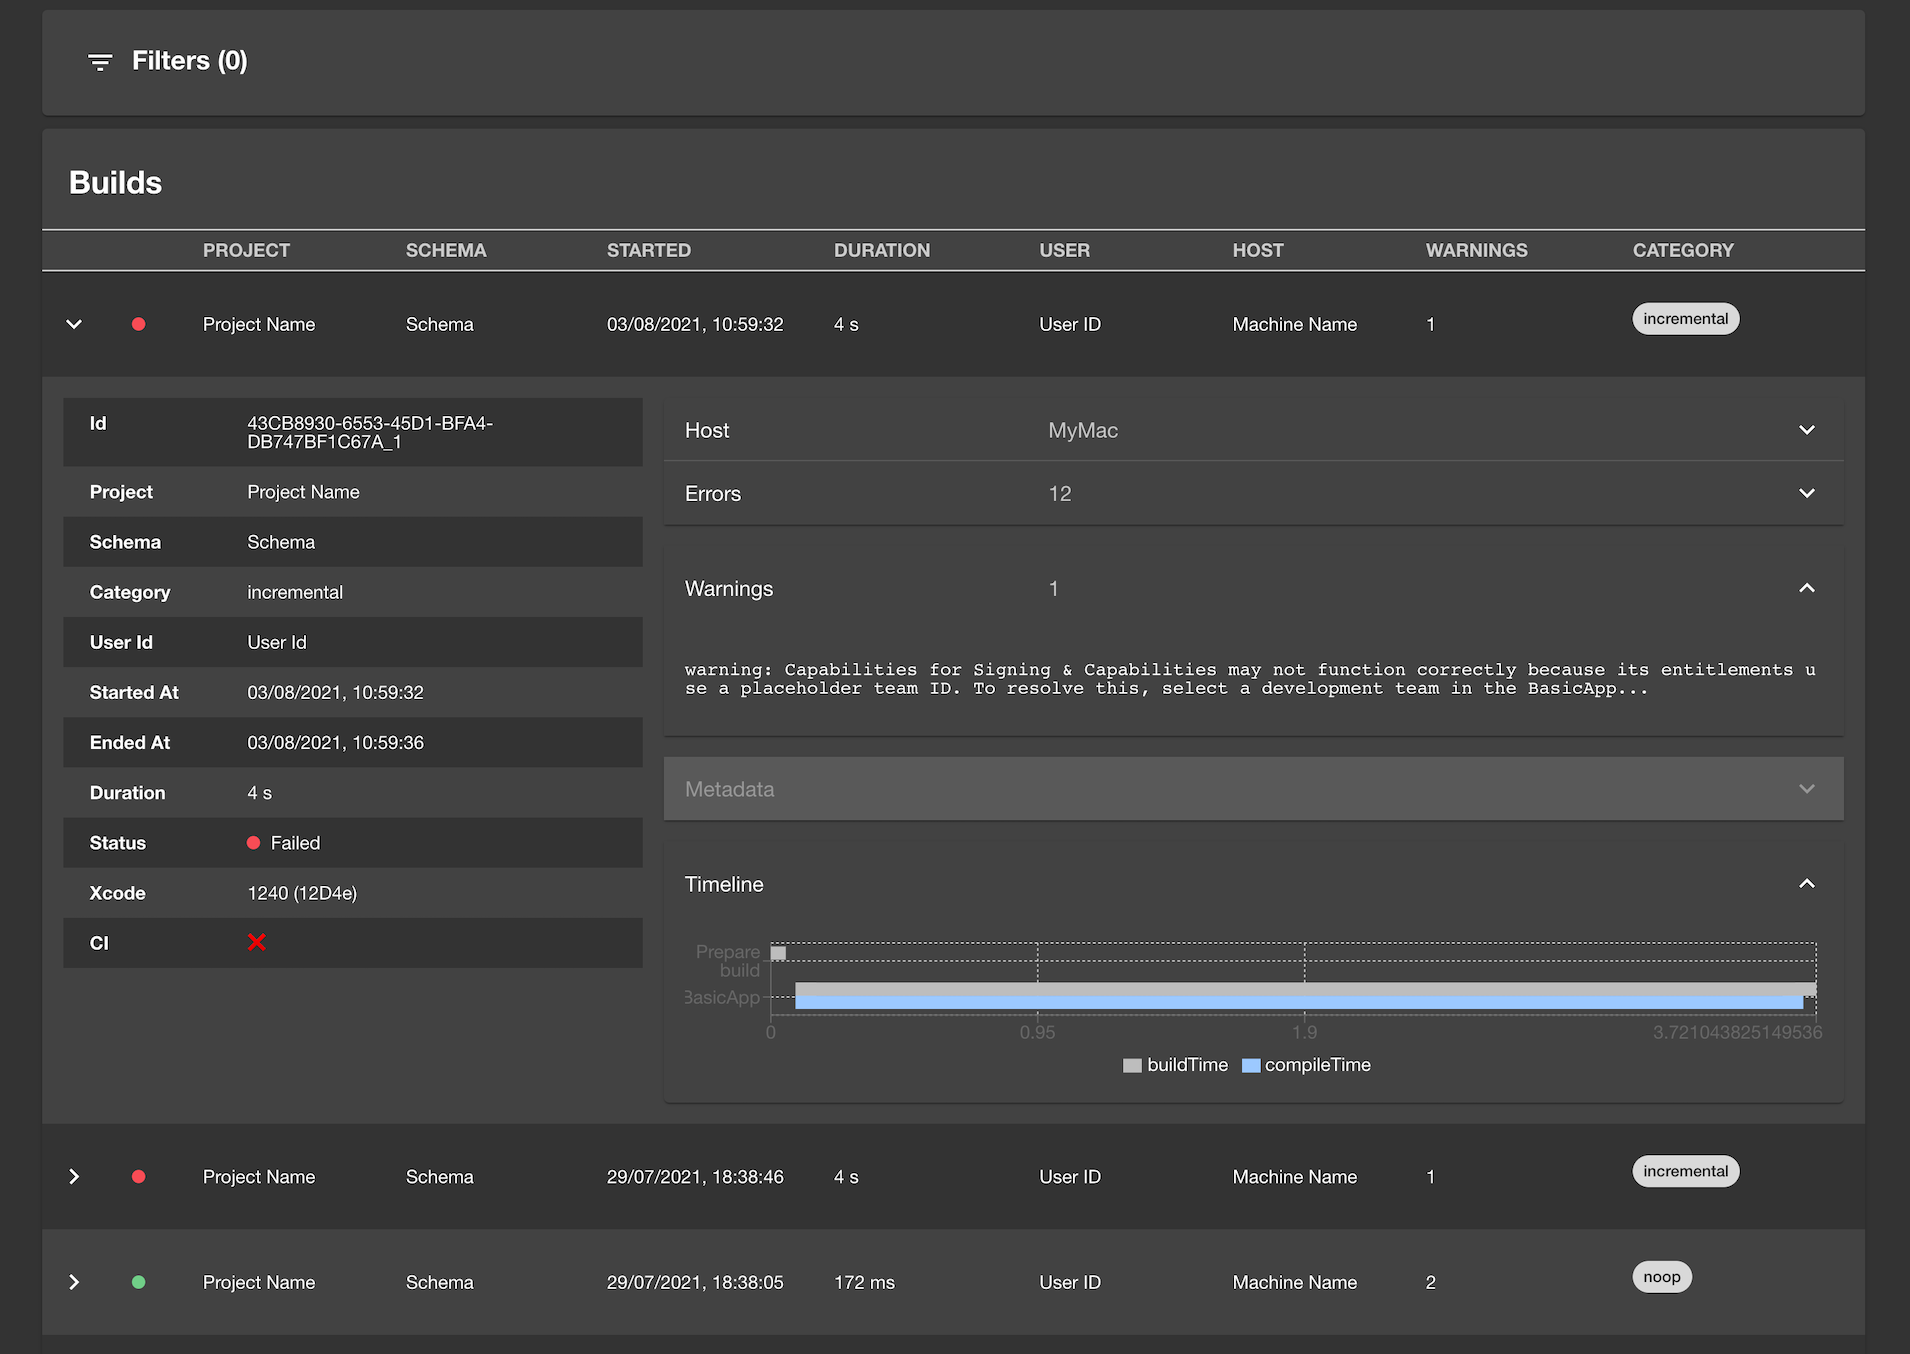
The data is then extracted from the xcactivitylog files and stored in easy-to-manipulate tables — allowing you to view build times, warnings, errors, and any other metadata, any way you want.

Your data stays with you
All data is safely stored on your machine and is only sent to a backend service that you host. You fully own the information, every step of the way.

Your data, any way you want it
Customize XCMetrics with the metrics that are important to you. All the tools are written in Swift to make it easier for iOS engineers to customize, extend, and contribute to the project.
Watch the demo video
See how XCMetrics works and how to set it up.
Backstage integration
The XCMetrics Backstage plugin offers a powerful web interface enabling you to get a visual overview and to dig deep into most of the collected metrics.